Why Statistical Cross-Validation Provides a Compelling Answer for Marvell’s (MRVL) Unusual Options Activity
/Semiconductor%20by%20Sach336699%20via%20Shutterstock.jpg)
As one of the top enterprises in the development and production of semiconductors, it’s no surprise to see that Marvell Technology (MRVL) has been one of the hot players in the broader artificial intelligence ecosystem. At the same time, the narrative isn’t bulletproof, as the tech giant found following the release of its second-quarter earnings report.
Last Friday, MRVL stock closed down almost 19% against the prior session. At first glance, the results appeared reasonable, with adjusted earnings per share landing at 67 cents, meeting the consensus estimate. Also, the chipmaker generated revenue of $2.01 billion, matching Wall Street’s expectations.
So, what was the issue? Weaker-than-expected data center revenue and a rather tepid guidance doomed MRVL stock.
Still, JPMorgan analyst Harlan Sur urged that investors should consider the long-term picture. Sure, the unexpected slowdown in the data center was disappointing. However, the expert pointed to the total revenue tally, which was a record. Therefore, the assumption is that demand for Marvell’s custom AI chips remains strong, facilitating a discount in MRVL stock.
As would be expected from such an acutely kinetic move, Marvell was one of the top stocks generating unusual options activity on Friday. Total volume in the derivatives space reached 611,650 contracts, representing a 385.51% lift over the trailing one-month average. However, call volume was only 318,933 contracts, leaving put volume at 292,717 contracts, yielding a lofty ratio of nearly 0.92.
Interestingly, though, options flow — which focuses exclusively on big block transactions likely placed by institutional investors — showed net trade sentiment hit $12.546 million above parity, thus favoring the bulls. Therefore, many of the previously mentioned puts were credit-based (sold), implying a neutral-to-bullish posture.
However, options data can be incredibly difficult to decipher because one is never truly sure what the motivations behind the transactions are. That’s where scientific methodologies to narrow down a “real-time” confidence interval for a particular falsifiable thesis.
Using Out-of-Sample Testing to Justify a Bullish Position in MRVL Stock
Every trading-focused article should clearly state a thesis; otherwise, what’s the point? My thesis is that because MRVL stock flashed a quantitative signal that historically leads to upside, Marvell should be on your radar. Specifically, in the past 10 weeks, MRVL printed four up weeks, six down weeks, with an overall downward trajectory. I classified this “behavioral state” as 4-6-D.
Now, under normal circumstances (using data going back to January 2019), MRVL stock features a natural drift that takes the stock to a median low of $61.33 to a median high of $65.55. These figures represent the aggregate of the dataset. However, the 4-6-D sequence creates a conditional drift that sends the price upward, between $63.53 and $69.70.
As such, the probability appears to be higher that over the next two months, MRVL stock will make its way northward. However, to have greater confidence in this thesis, you would need to apply a time-dependent cross-validation test, simply known as out-of-sample testing.
Practically without exception, financial publications rely on in-sample assertions, which are claims and conclusions drawn entirely from the same dataset that was used to develop it; in other words, there is no separation between discovery and validation. This is how asinine aphorisms like “the trend is your friend until it ends” become dogma.
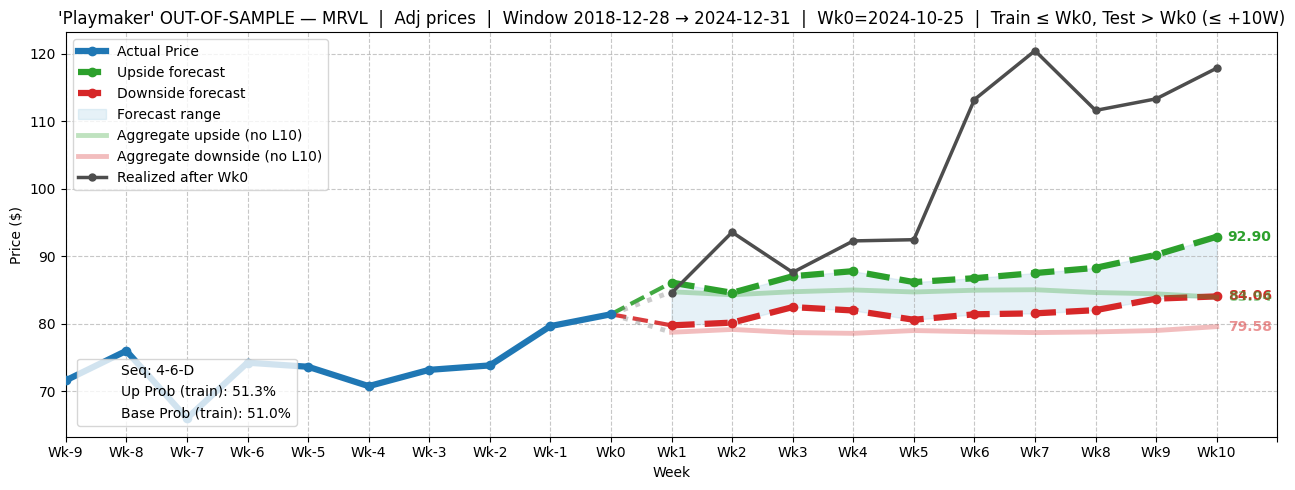
Subsequently, in order to understand whether the 4-6-D sequence is potentially valid, we need to test its assumptions in other time ranges. From 2019 through the end of 2014, the conditional skew is noticeably greater than the baseline skew, which is to be expected.
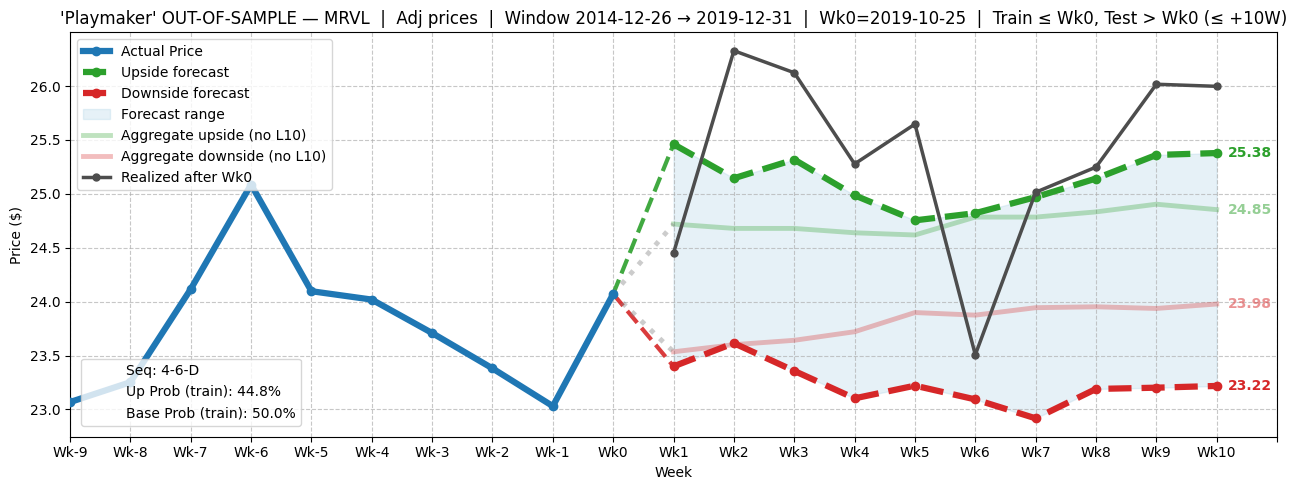
In testing the sequence between 2015 through the end of 2019, the conditional skew was much wider than the baseline skew. However, the important takeaway here was that the upper conditional skew was higher than the baseline skew, indicating upside potential beyond the aggregate expectation.
Finally, the sample period between 2010 through the end of 2014 showed the conditional skew dipping below the baseline skew. Admittedly, this is where the testing failed.
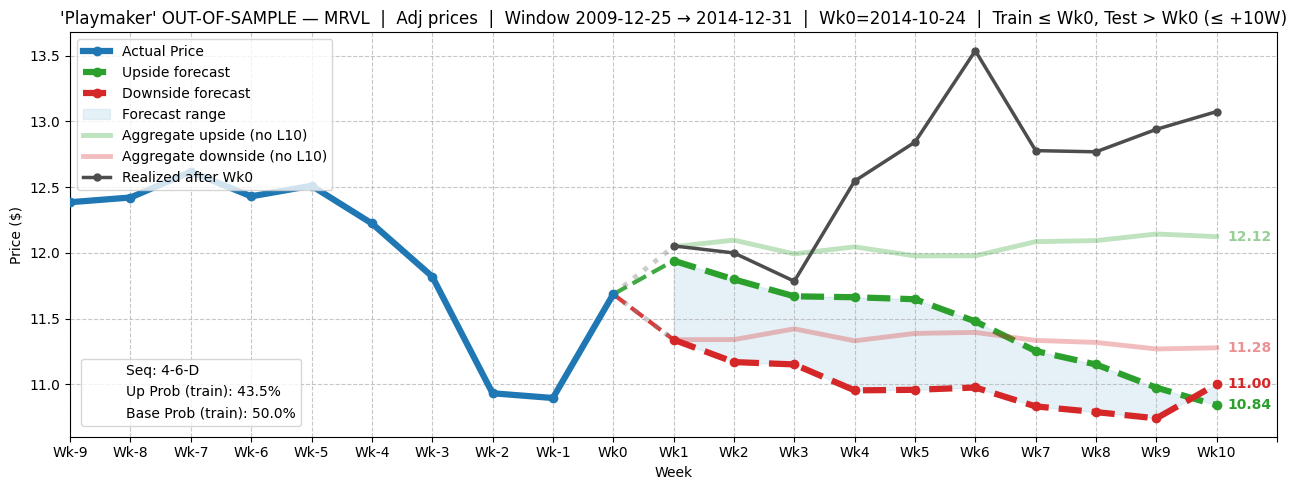
Nevertheless, the failure could be reasonably explained by the sample’s proximity to the Great Recession. Also, it’s worth pointing out that during that time, MRVL stock suffered a sizable decline in value yet popped smartly higher.
It’s my belief that, based on in-sample and out-of-sample data, MRVL stock is a discounted buying opportunity.
Aiming for the $70 Price Target
Using the market intelligence above, the idea that’s arguably the most enticing is the 65/70 bull call spread expiring Nov. 21. This transaction involves buying the $65 call and simultaneously selling the $70 call, for a net debit paid of $185 (the most that can be lost in the trade). Should MRVL stock rise through the short strike price ($70) at expiration, the maximum profit would be $315, a payout of over 170%.
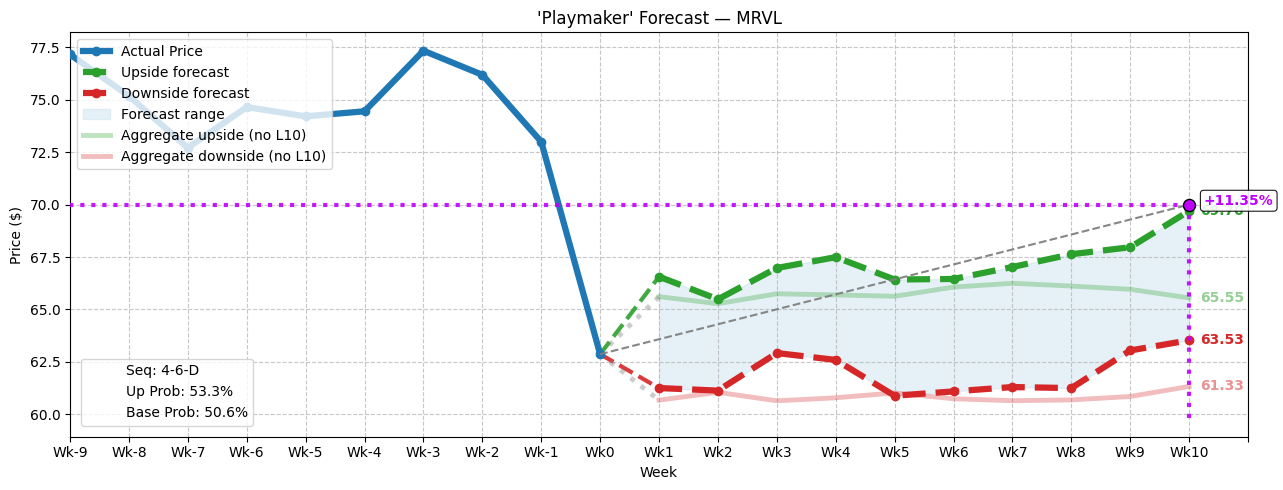
To be sure, this trade is ambitious, with the short strike being over 11% above Friday’s close. However, the extra time to expiration (about 12 weeks out, not 10 as listed in the chart above) makes the transaction appealing. Further, based on past analogs, MRVL stock under the positive scenario should be able to hit the profitability target.
On a parting note, the most recent out-of-sample tests show that the 4-6-D sequence tends to yield an upward trajectory. Therefore, Marvell is a name to watch closely over the next several weeks.
On the date of publication, Josh Enomoto did not have (either directly or indirectly) positions in any of the securities mentioned in this article. All information and data in this article is solely for informational purposes. For more information please view the Barchart Disclosure Policy here.